
Higher-Timeframe ADX On or Off in CLOUDPips Sora: Does More Filtering Make a Better Bot?
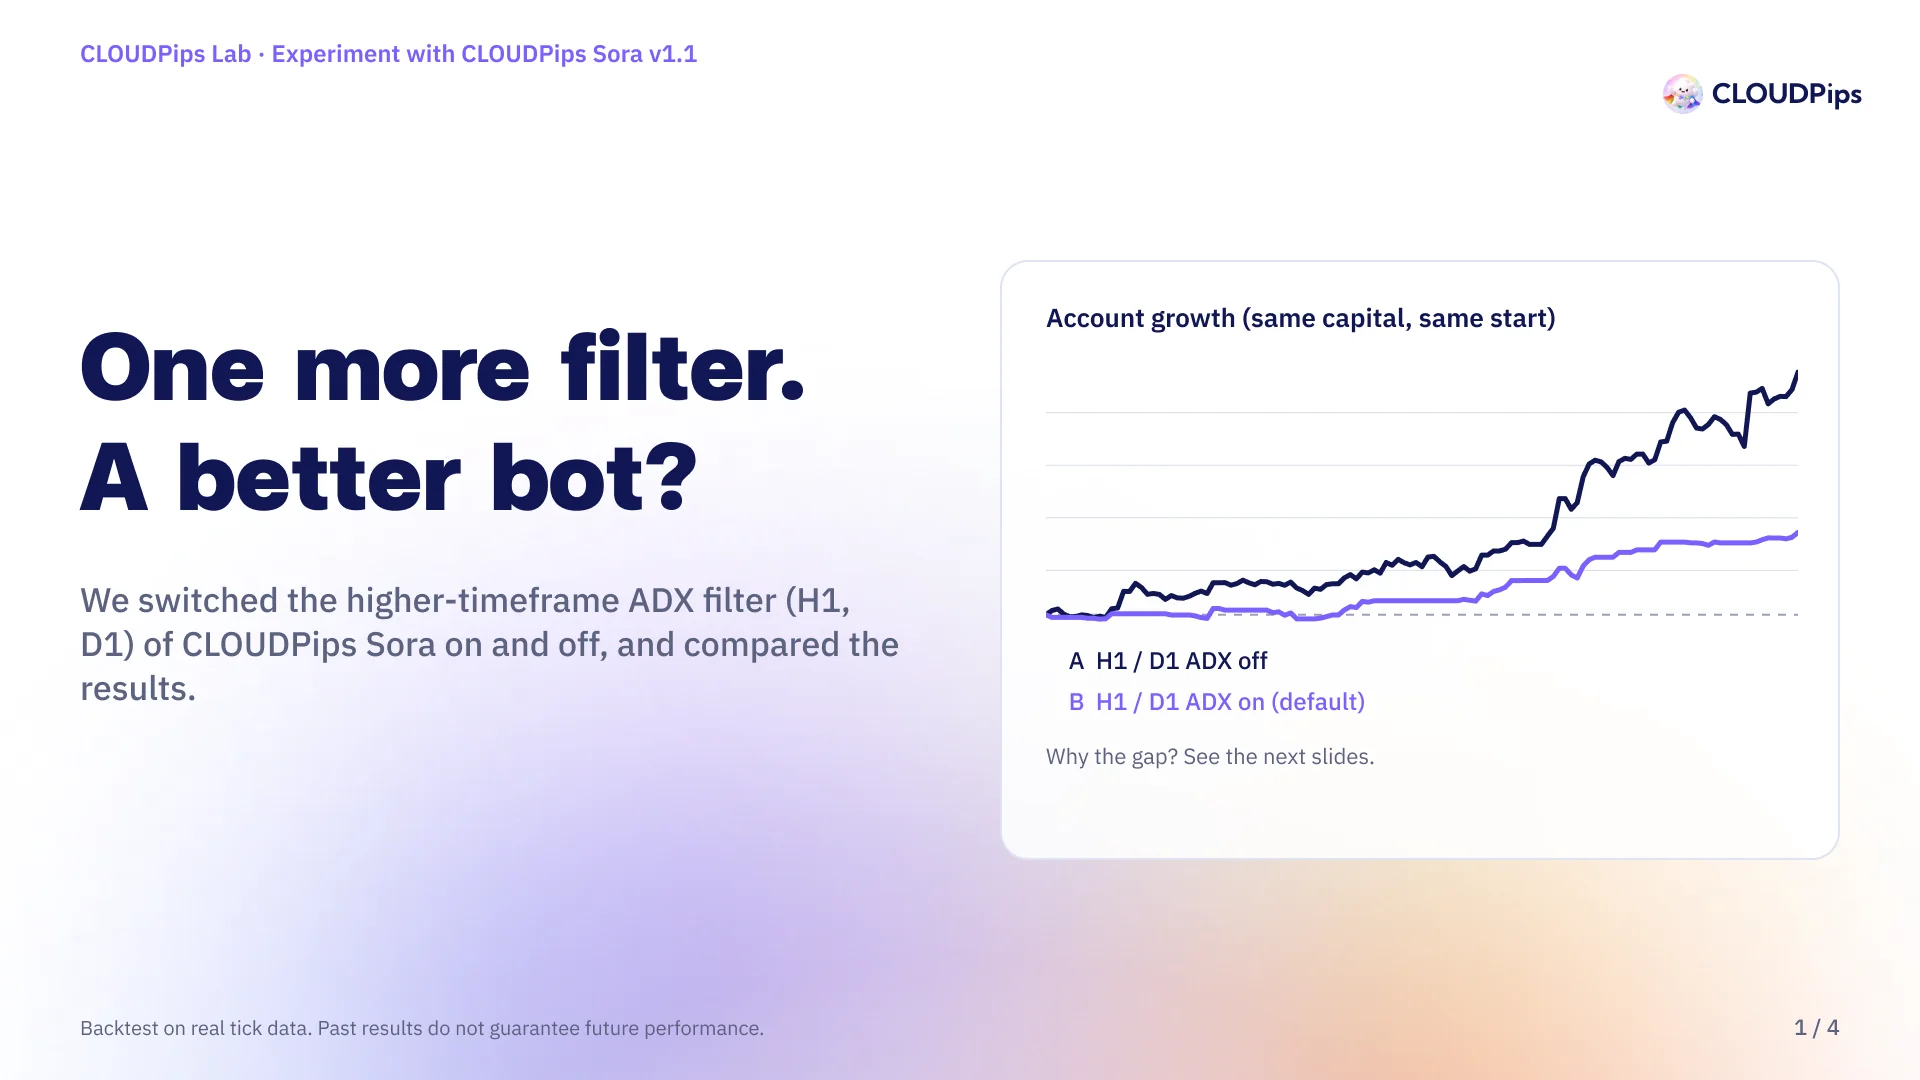
When a trading bot loses money in choppy markets, the first fix most people reach for is another filter. It sounds sensible, but every filter has a price. This article tests, on real data, how the second-layer filter in CLOUDPips Sora changes the results, and helps you pick the setting that suits you.
The question
The EA in this test is CLOUDPips Sora v1.1, a trend-following bot for gold (XAUUSD). It reads the trend with Supertrend and already uses ADX on M5 as a filter, to avoid trading when the market has no momentum.
Version 1.1 adds a second filter layer: ADX on the higher timeframes (H1 and D1), so the bot only trades when the market has momentum on both the small and the big picture. It is on by default. The question is: does this second layer actually make the bot better?
What is ADX?
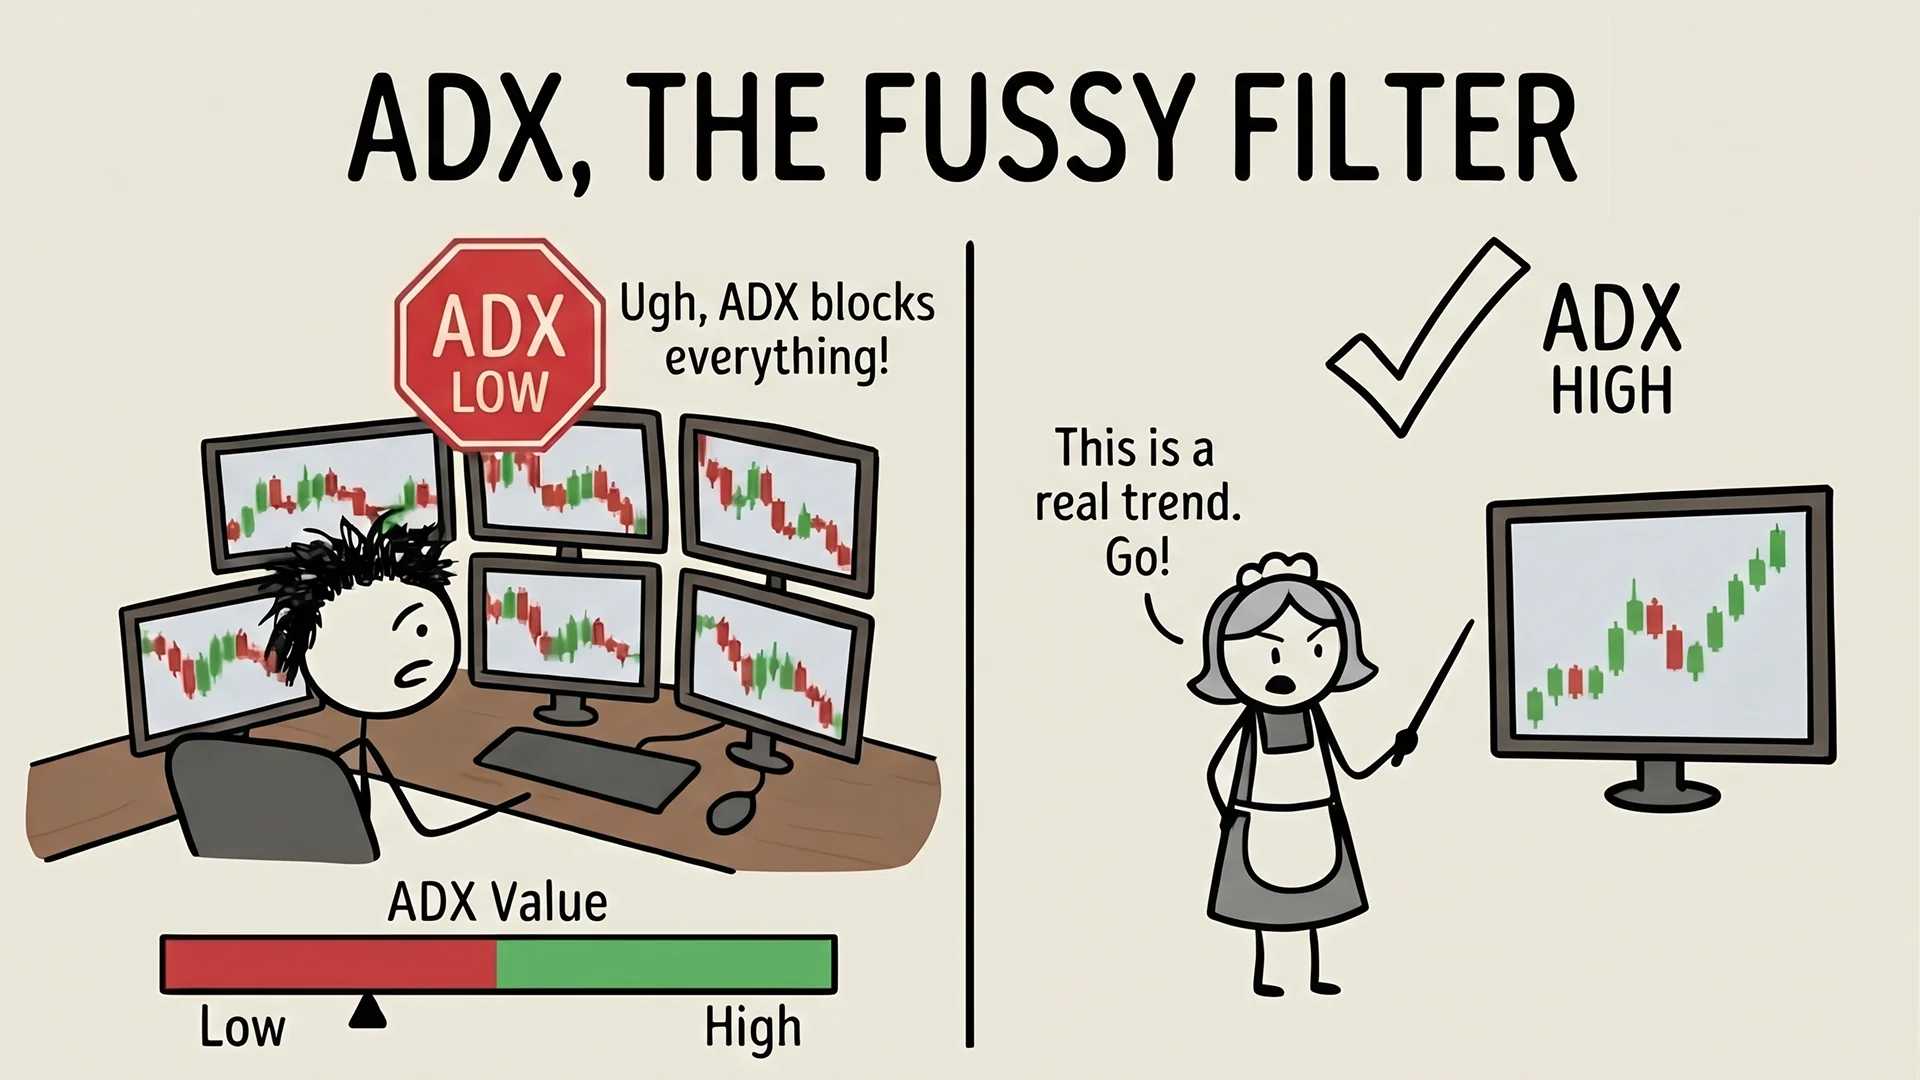
ADX stands for Average Directional Index. It was created by J. Welles Wilder, the same person behind RSI, and measures trend strength on a scale of 0 to 100. A low value means the market is drifting sideways; a high value means price is trending. ADX does not tell you the direction: a strong rise and a strong fall both give a high ADX.
Experiment setup
A reliable experiment changes only one thing. If several things change at once, you cannot tell which one caused the difference. So this test runs Sora twice, identical in every way except one variable.
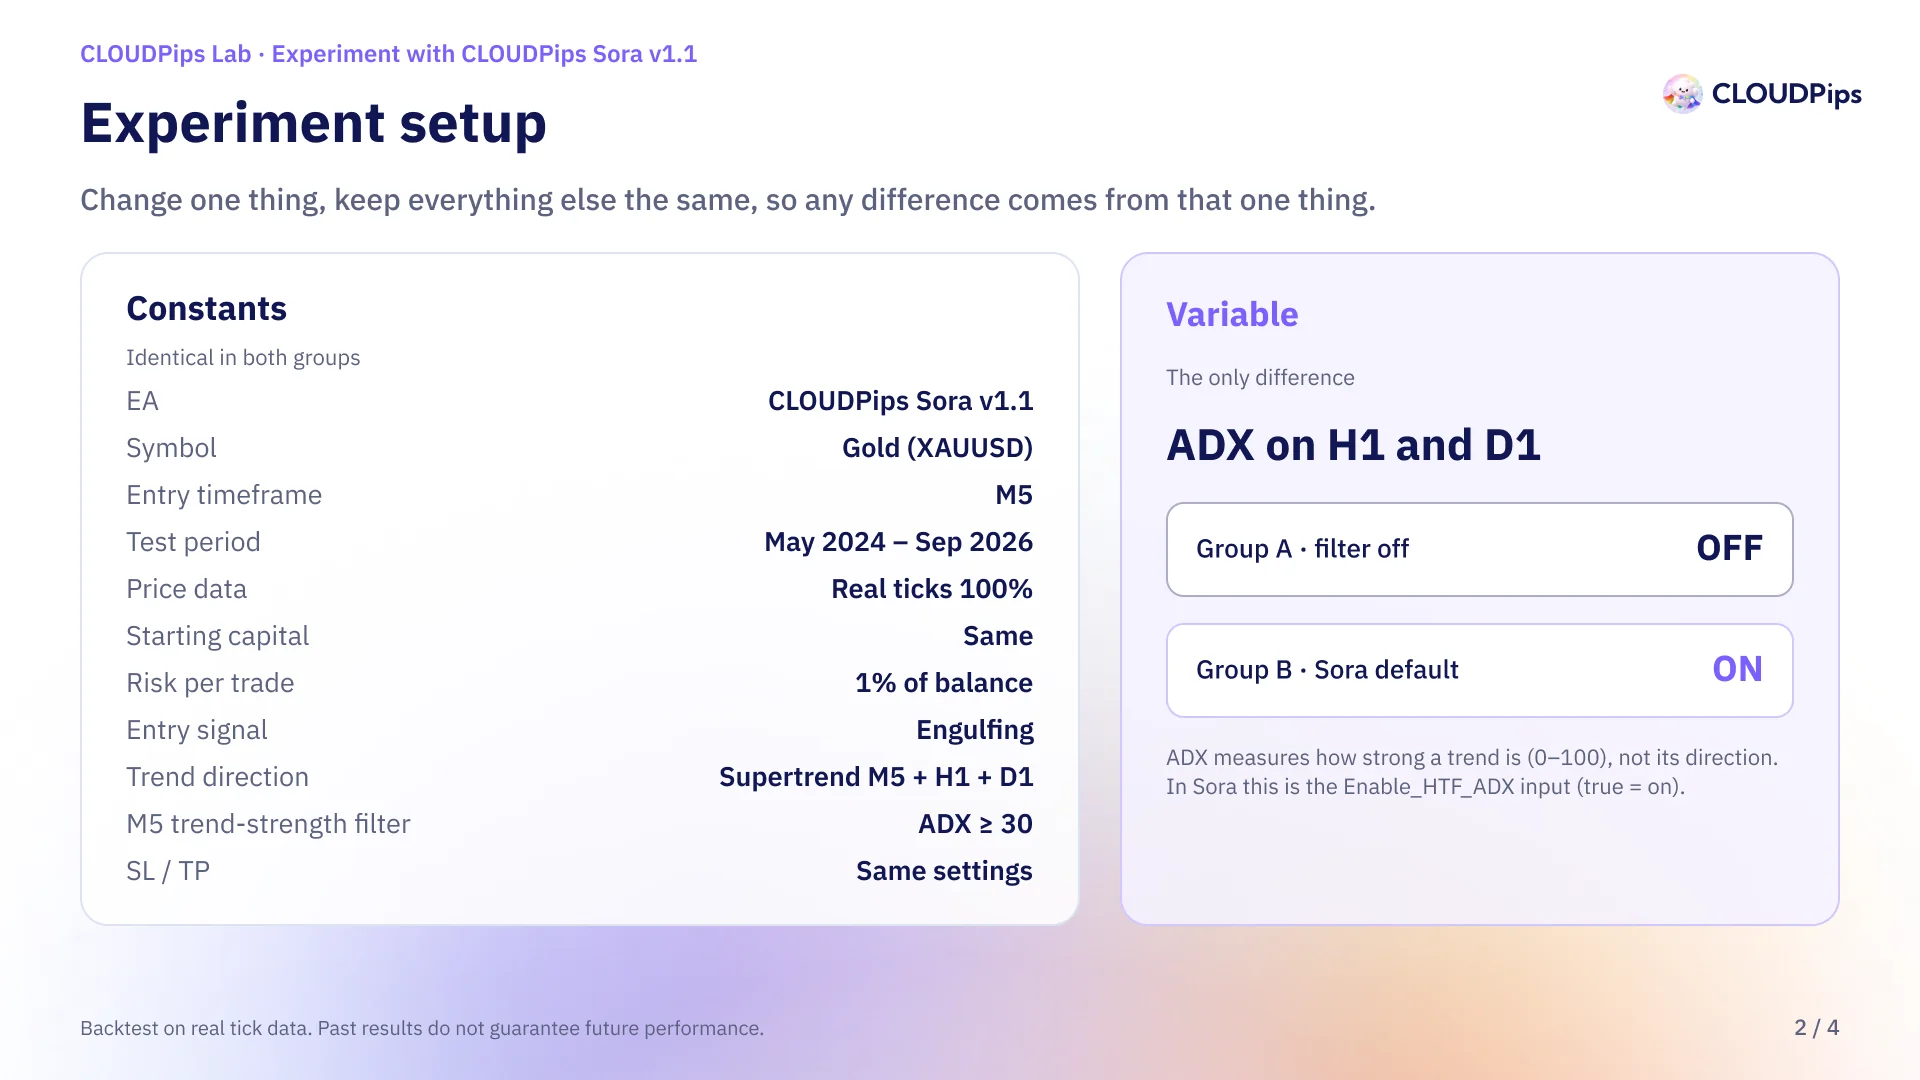
Constants (identical in both groups)
| Item | Value |
|---|---|
| EA | CLOUDPips Sora v1.1 |
| Symbol | Gold (XAUUSD) |
| Entry timeframe | M5 |
| Test period | May 2024 – Sep 2026 |
| Price data | Real ticks 100% |
| Starting capital | Same |
| Risk per trade | 1% of balance |
| Entry signal | Engulfing |
| Trend direction | Supertrend M5 + H1 + D1 |
| M5 trend-strength filter | ADX ≥ 30 |
| SL / TP | Same settings |
Variable (the only difference): ADX on H1 and D1 (the Enable_HTF_ADX input)
- Group A: off (
Enable_HTF_ADX = false) - Group B: on (
Enable_HTF_ADX = true), the Sora v1.1 default. Every higher timeframe must show ADX above the threshold before the bot trades.
Results: how differently did the account grow?
The chart below is drawn from the real trades of both groups. The horizontal axis is the date, and both lines start from the same capital at the same point.
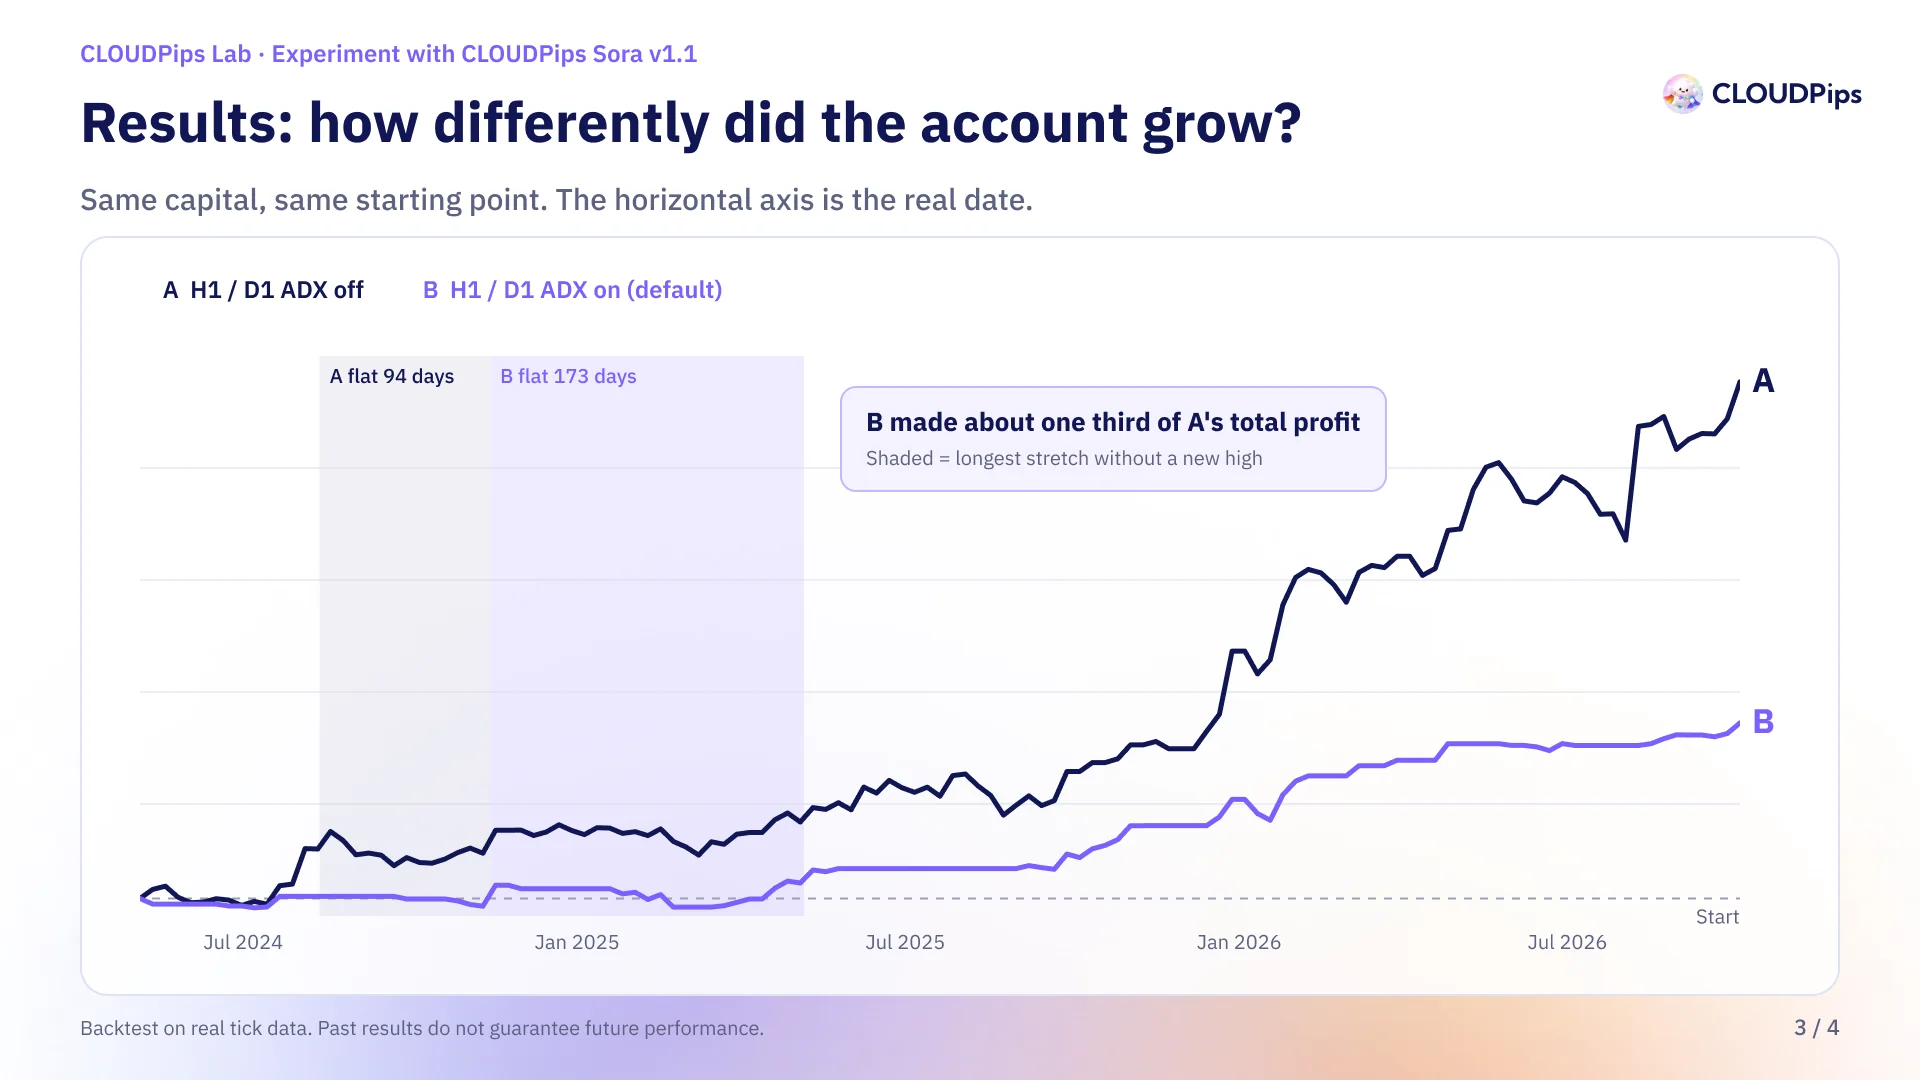
Line A (filter off) swings more but goes much further. Line B (filter on) is smoother but grows slowly. In the end, B made about one third of A's total profit.
The shaded areas show each group's longest stretch without a new account high. Group A went 94 days (Aug – Nov 2024); group B went 173 days (Nov 2024 – May 2025), almost half a year.
All the numbers
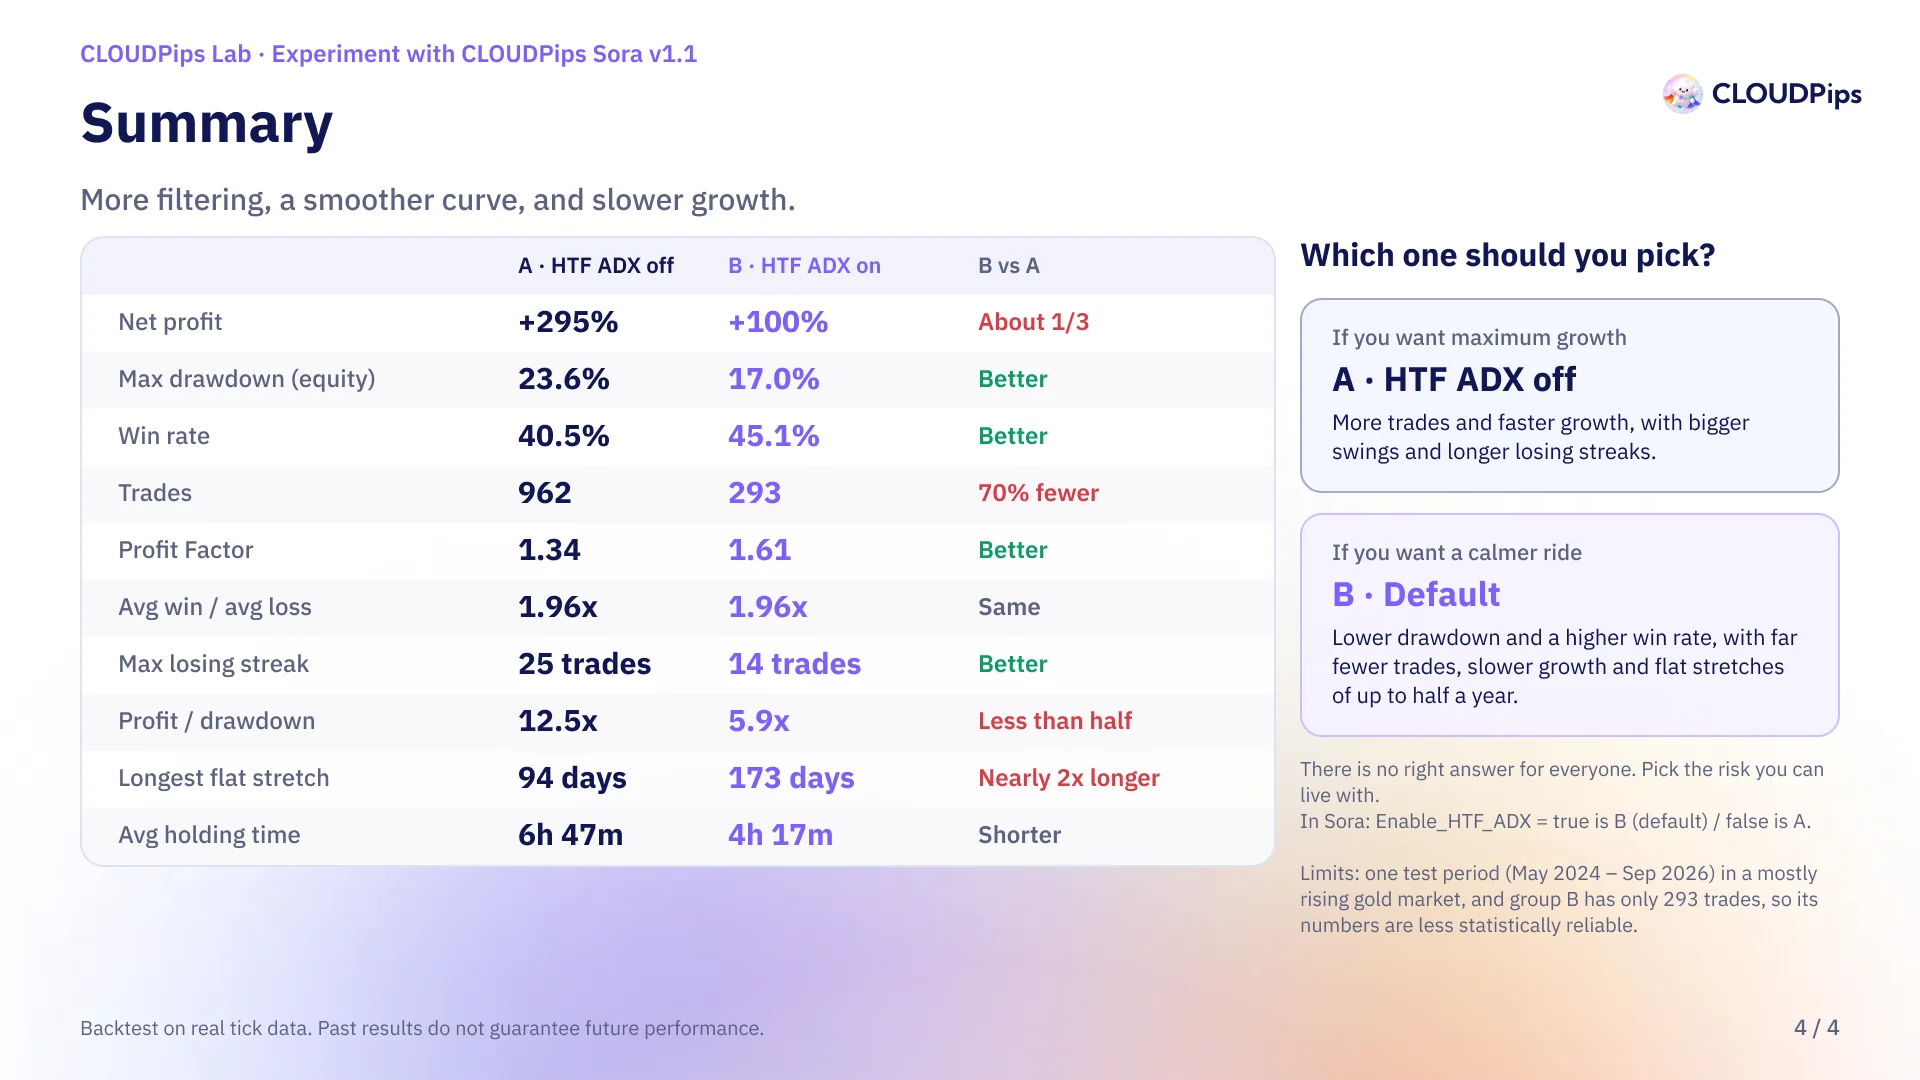
| Metric | A · HTF ADX off | B · HTF ADX on | B vs A |
|---|---|---|---|
| Net profit | +295% | +100% | About 1/3 |
| Max drawdown (equity) | 23.6% | 17.0% | Better |
| Win rate | 40.5% | 45.1% | Better |
| Trades | 962 | 293 | 70% fewer |
| Profit factor | 1.34 | 1.61 | Better |
| Avg win / avg loss | 1.96x | 1.96x | Same |
| Max losing streak | 25 trades | 14 trades | Better |
| Profit / drawdown | 12.5x | 5.9x | Less than half |
| Longest flat stretch | 94 days | 173 days | Nearly 2x longer |
| Avg holding time | 6h 47m | 4h 17m | Shorter |
How to read these numbers
- Max drawdown is the deepest fall from a peak, in percent. Lower means less pain in the worst period.
- Profit factor is total profit divided by total loss. Above 1 means profitable; higher is better.
- Profit / drawdown is net profit divided by max drawdown: how much profit you earned per unit of pain.
- Flat stretch is the time the account goes without a new high. It is often overlooked, but in real life, watching an account sit still for months is harder than it sounds.
Why did this happen?
The second filter does what it was designed to do: it removes trades when the market lacks momentum. That is why group B wins more often, has a lower drawdown and shorter losing streaks.
But ADX on D1 moves very slowly. By the time it confirms momentum, the trend has often travelled a long way. Good trades at the start of a trend get filtered out too, so group B has 70% fewer trades and less total profit.
Interestingly, the average win is 1.96 times the average loss in both groups. The filter does not make each trade earn more; it just selects fewer, more accurate trades. The shorter average holding time shows that group B only enters when price is moving fast, so its trades end sooner.
Which one should you pick?
The experiment does not say one setting is better. It shows what each one trades off.
A (H1/D1 ADX off) suits you if you want maximum growth. More trades and faster growth, with bigger swings and longer losing streaks.
B (H1/D1 ADX on, the default) suits you if you want a calmer ride. Lower drawdown and a higher win rate, with far fewer trades, slower growth, and flat stretches of up to half a year.
A filter does not make a bot better or worse; it changes its personality. The more useful question is not "which numbers look better?" but "which risk can I genuinely live with?"
How to set it in Sora: the Sora v1.1 default is B. For A, open the EA settings, go to the Inputs tab, find the Multi-Timeframe ADX Confirmation group, and set Enable_HTF_ADX to false. Nothing else needs to change.
Limits of this experiment
- One test period (May 2024 – Sep 2026), during which gold rose almost the whole time. Results in a long downtrend or sideways market may differ.
- Group B has only 293 trades. Good-looking numbers from a small number of trades are less statistically reliable than group A's 962.
- It is a backtest. Past results do not guarantee future performance.
Read the original post and join the conversation on Facebook.
Risk warning: Trading gold and derivatives carries a high level of risk and may not be suitable for all investors. Backtest results do not guarantee future performance. You may lose all of your invested capital. Do not trade with money you cannot afford to lose.
Updated 8 October 2026
Still stuck? Email us at support@cloudpips.io or message LINE @cloudpipsfx and we'll help you sort it out.